
What Organized Data Looks Like
Many times on this blog I have described the data profession as “organizing data”. This description is short, simple and relatable.
But recently I’ve wondered how effective it is. I needed a reader from outside the data industry to provide feedback. I knew one reader in particular that I could count on to give me their honest opinion; my wife.
I asked my wife if “organizing data” made sense. Her response: “I love it. But I need more detail.”
I understood what she meant immediately. This is exactly how I felt about data when I first started. I understood the theory, but nothing clicked for me until I saw examples.
I’ve tried to keep my writing short and simple on Occam’s Data to avoid boring my readers with technical jargon that flies over their head. But my desired outcome is for my readers to have a better understanding of data and the role it plays in their lives.
In this post I will provide more depth to what “organizing data” means. I’ll walk through a brief history of the computer and how it has led to an epidemic of unorganized data. I’ll also walk through an example of a fictional business with data problems. The business may be fake, but the problems are very real.
Unorganized Data
It’s easy to understand opposites. Organized data is the opposite of unorganized data. The latter is something that most people experience quite regularly. Let’s look at some examples of how unorganized data has likely impacted your life.
Have you ever…
searched through a pile of papers for a receipt we need for an expense report?
forgotten the password for a login?
misplaced product manuals, warranties, recipes, books, contracts, documents, and tax returns?
Data is information. These are all examples of misplaced **information making our lives more frustrating and slowing us down. Unorganized data costs us time and creates stress.
The harder it is for us to find information, the less likely we are to use it.
When Data Doesn’t Make Sense
We also don’t use information when we don’t understand it. Organized data does not just mean data in the right place at the right time.
A menu, for example, usually contains information that is easy to understand. It is a list of dishes, the ingredients in each dish, and the corresponding price. A well-written menu is actionable. You know what you want when you see it, and you order it.
Tax codes, on the other hand, are rarely actionable. A tax code is information that is complex and very difficult to understand. This is why most people hire lawyers or accountants to organize and interpret tax codes for them, and determine what actions they should take.
Organized data means information you need when you need it. It also means that that information will help you determine what to do next.
Unorganized Data In Business
Businesses also suffer from unorganized data. Consider an investment bank as an example. Let’s assume this bank exists at a time when computers were not as prolific as they are today.
When a banker at this bank meets with a client, that banker needs to search through a drawer to find a file containing the information they need to serve their client. If that drawer is a pile of bank statements, credit reports, and local takeout menus, it could take the banker hours to find the information they need. Or worse, that information could be incomplete or inaccurate. Unorganized data at a business can result in unhappy customers, lost revenue, and even lawsuits.
To mitigate this risk, businesses will set up systems to keep their information organized. They utilize folders, binders, and file cabinets as organizing tools. You are likely familiar with such a system. If you benefit from one of these systems, then you are experiencing the benefits of organized data.
The information at a business is only as reliable as the system the business has in place to organize that information.
What is a “system”?
What is a system? It’s a set of rules that people can follow to produce a desired outcome.
An alphabetized file structure is a system. You have one folder for each letter of the alphabet. When a new piece of information comes in, it is stored in the folder with the first letter of the name of that information. This system has one rule: All information must be placed into the folder of the first letter of its name.
Not all systems are this simple. File cabinets, folders, and binders are simple tools for simple systems. They cannot keep up with the complexity nor the amount of information that we need to organize in present times.
What has changed?
Why are these physical tools ill-equipped to organize our information today? Because the way we produce that information is no longer physical. A brief history of the computer and the internet should help explain what I mean, and hopefully connect the dots to what organized data means in present times.
The Computer
A computer (the thing you’re using to read this) is a machine. It is a machine that stores and manages information (it also performs tasks with this information, but let’s ignore that for now). “Information Technology” (or “IT” as most people call it) is the practice of managing the technology that captures, stores, and manages our information- a.k.a computers.
Throughout the 20th century, innovation improved computers’ ability to store information. This innovation improved the amount of information that computers can store, and the speed that computers can process and retrieve information. Therefore, as computers technology improved, our information supply grew.
Information is a resource. But resources have no value in isolation. Oil has no value unless we process it into petroleum. Wheat has no value until we process it into flour.
This was a problem for computers. Vast amounts of information existed on large machines in specific locations that had the capacity for such machines. This was a problem until the development of the “personal computer” (PCs).
The era of “personal computers” (PCs) began in the late 1970s. This era gave rise to the proliferation of computers throughout households across the world. The ability to rapidly capture, process, and leverage information was no longer limited to organizations who could afford the space and price of the massive machines that were previously required.
This development also changed the kind of information that computers were storing. The households that now had access to this information technology, were the people providing the information that the technology was storing.
The Internet
In 1990 Tim Berners-Lee developed the “networked hypertext system”, also known as the “World Wide Web.” Today we call this system the Internet.
While personal computers enable millions of households to store information, the Internet enables the world to publicly access this information.
Consider the impact of the Internet on how we obtain information today:
Instead of calling a restaurant to ask for directions on how to get there, we simply visit the restaurant’s website.
We no longer need to leaf through a 10 lb. dictionary to look up the definition for a word. We can look it up on dictionary.com.
Students don’t need to attend a classroom to learn a new subject.
We don’t need to go to a movie theater to watch a movie (fictional information is still information).
We don’t need to call people. We use a tiny computer in our pocket to send people information through the internet.
I don’t bring all these examples so that you will be inspired by the power of innovation. I want my readers to understand that the only thing that has changed in our society over the past 50 years of technology advancement is the ability to mass produce information.
Case Study: Greenleaf Financial
Let’s bring this history lesson full circle. Remember our investment bank from earlier? Imagine that that investment bank has traveled through time to present day. Let’s call this bank Greenleaf Financial.
Stan is the CEO of Greenleaf Financial (Greenleaf for short). Stan has an idea for attracting new customers. He wants to find out which industries are the most popular amongst Greenleaf’s customers. He then wants to use targeted marketing campaigns to attract more customers from those industries. Fortunately the bankers at Greenleaf collect this information from their customers using software called Bankshot.
Unorganized Data in Practice
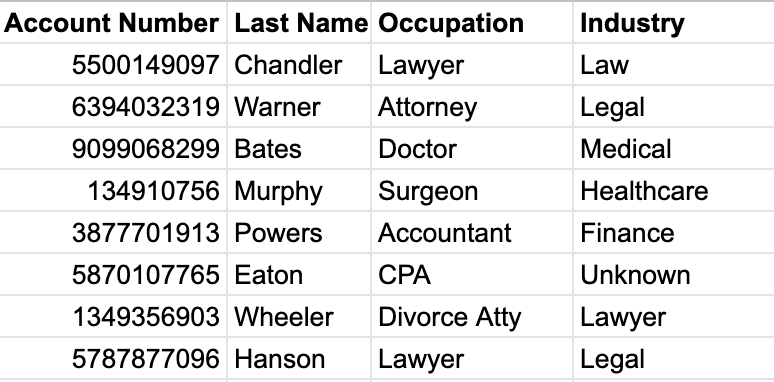
Stan goes into Bankshot and downloads a report of all the customers at Greenleaf. He receives a spreadsheet from Bankshot of each customer, their occupation, and their Industry. Below is a sample of the data:
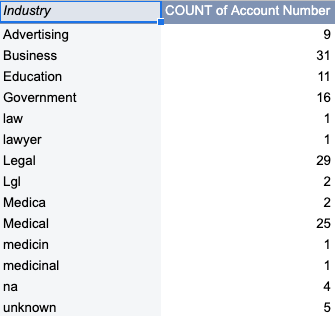
Stan is savvy enough with excel that he’s able to create a simple pivot table to count all the customers in each Industry.
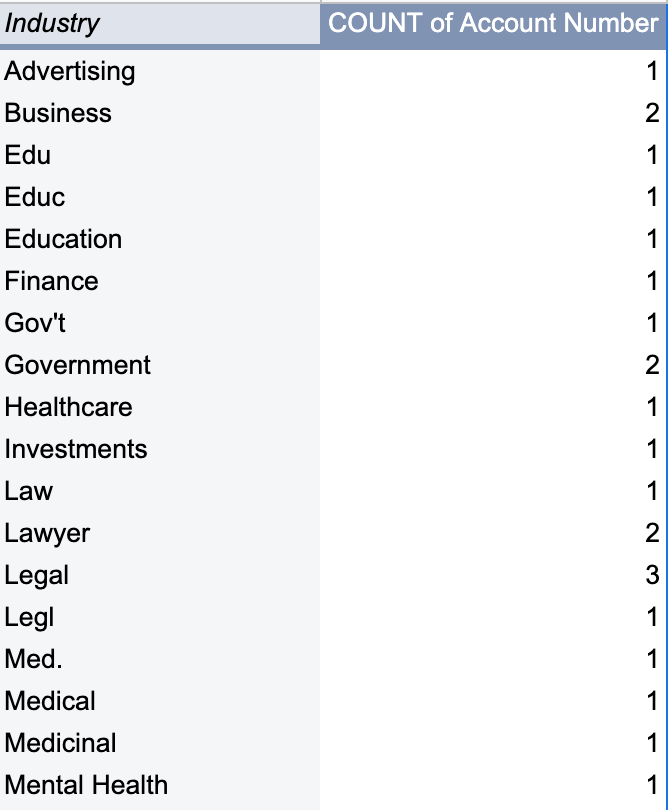
This is not what Stan was hoping for. He was expecting the report to be more insightful. He realizes the data is dirty.
Organized Data: Good
Stan takes some time to clean up the data in the spreadsheet. The report is now much more helpful.
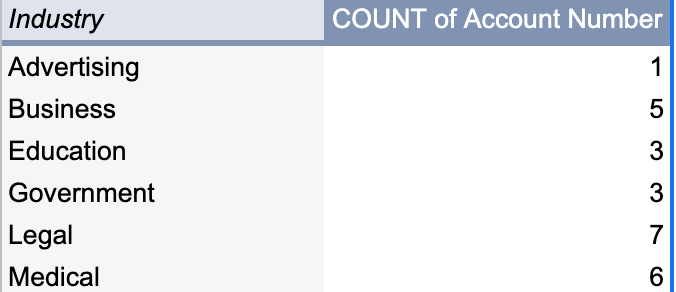
The effort Stan put in to clean the data in the spreadsheet was worth his time. He was able to use this report to create targeted marketing campaigns.
So the moral of this story is that clean data is better than dirty data, right? Yes…but not entirely.
The Problem Returns
It’s been 3 months since Stan used the Bankshot data to create targeted marketing campaigns. Stan is extremely pleased with the results of this effort. Greenleaf Financial has onboarded more new customers in that quarter than they did the entire previous year!
Now Stan wants to see an updated version of that same report from Bankshot to see the impact of the targeted campaigns on each industry. He downloads the same spreadsheet from Bankshot, and updates his report with the new data. He sees the following:
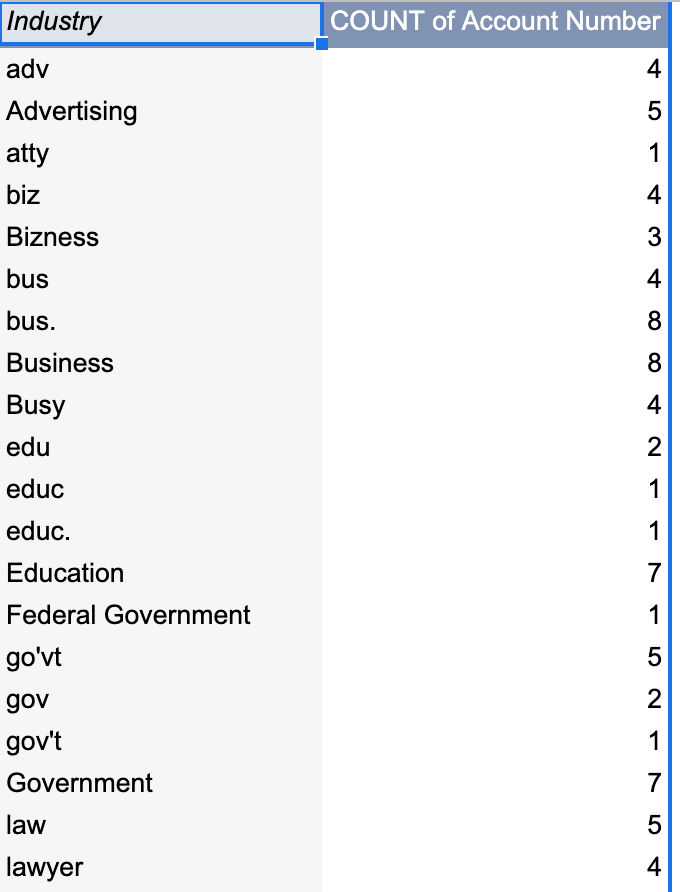
Now Stan is upset! What happened? He spent all that time fixing the data for the last report. Now the problem has returned, and this time it’s much worse.
Organized Data: Better
Stan did not want to spend any more time fixing the customer data. He needed to address the problem at the source, but where was the source? He asked himself the following question:
Where does this information come from?
The answer to this question: Stan’s employees; the bankers at Greenleaf Financial. The bankers enter information about their customers in Bankshot. But they had no rules to follow on what information they were allowed to enter. There were no rules. There was no system.
To fix this problem, Stan created a list of the industries that resulted from his first round of cleanup. The list included the following:
Advertising
Business
Education
Government
Legal
Medical
Unknown
He distributed this list to all of the bankers at Greenleaf and requested that they only choose from this list when collecting industry information from customers. Stan would review the results of his new system in three months.
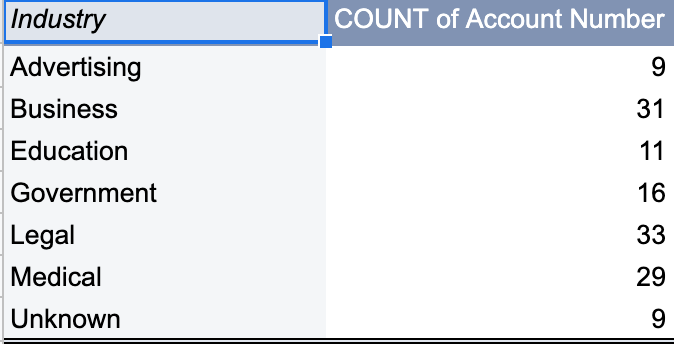
And in three months, Stan went to Bankshot to download the data again. When he recreated his favorite report, he saw the following:
He notices improvement in the results. The report is much more insightful than the previous one. Business, Legal, and Medical stand out as the most popular industries. He’s still disappointed though, because his process is clearly still flawed.
Organized Data: Best
Stan had created rules to organize Greenleaf’s data. So why was there still issues? Because he had no way to enforce these rules.
Stan added a dropdown selector in the customer form in Bankshot. The selector limited the answers that the bankers could choose from for the customer’s Industry.
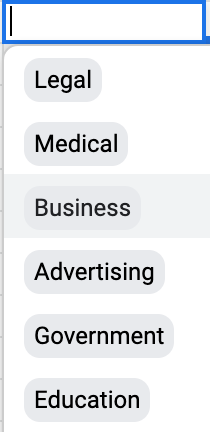
At last, Stan had a report and a system that he could rely on for creating effective marketing campaigns.
Data Comes From Humans
Data is information. It is information stored in computers…by humans. Humans make mistakes. And as a result, data can often be wrong.
I mentioned in a previous post that data doesn’t always validate our intuition. Often times our intuition is in fact, validating our data. Stan’s report is a good example of this. In its messiest version, the report tells us that Education is the most popular industry. Stan knew this couldn’t be true. He had just sent out targeted campaigns to Business, Legal, and Medical professionals since these were the most popular industries from the initial version of the report.
It was Stan’s intuition that led to the insight he was looking for, not the data alone. Stan was an analyst. He has no math or technical background, yet he was able to use data to make an informed decision.
The Information Age
There is a lot to takeaway from the Greenleaf Financial case study. Yes, clean data is better than dirty data. But the point I really want to drive home with my readers is that you can (and should) play an active role in organizing and leveraging your data.
We saw how Stan played a role in his organization. You can do this in yours.
We live in the information age. We have an abundance of information literally at our fingertips. We live in a time when everyone seems to think that ChatGPT is going to replace all of our jobs.
As long as we have all this information, we’re going to need humans who need to manage it. We’ll need people who know how to think, who know how to create systems that keep information organized, and who can use that information productively.
You don’t need to have any technical skills. You don’t need to have the word “data” in your job title. You only need to understand where information comes from, and how it might be useful.
Loved the section "Data Comes from Humans." Thank you for sharing this! It's given me better perspective.